🧪 Open Loyalty AI Labs: From challenge to prototype in weeks
Learn more


Creating your own loyalty program involves choosing the best-performing loyalty mechanisms, incentives tailored to your industry and target audience, and core metrics to track success. Do you think you've chosen the right set of metrics to measure customer loyalty?
If you're looking for a one-stop place with expert-tested metrics for a successful loyalty program, you're in the right place!
From switching ratio, NPS, and enrollment rate to upsell or participation rate, we've put together nine essential loyalty program metrics so that you can measure your scheme and follow best-practice guidelines.
In the last article, we discussed the benefits of loyalty programs, but what about loyalty itself – is it essential for business? Let's start with the reasons why focusing on building customer loyalty may be the business transformation you need.
First, if customers are loyal to your brand, they're more likely to use other products or services from your offerings. This, in turn, will ultimately increase your overall sales. A customer who once trusted your brand and found it profitable will undoubtedly pick up your offer again.
Another reason is that loyal customers are more likely to recommend your brand to their relatives and close friends. Data shows that 90% of people trust suggestions from family and friends. This is known as word-of-mouth marketing and is very important for the organic growth of your customer base.
The next key reason is that truehearted customers are more willing to give you feedback. There's always room for improvement, and because you've made a good impression on your customers, they'll give you pointers on how to make the overall experience even more appealing to them. Go ahead and ask them about their feelings and sentiments. Listen to them closely, as there's no better or more reliable data source.
In addition, loyal customers are less open to marketing or sales pitches from your competitors. They can't be so easily enticed to make the switch because they've already found their go-to provider –— your brand it is.
Yet another reason why customer loyalty is vital to your business is that truehearted customers can forgive you for petty or even bigger slip-ups. Data shows that 78% of customers will let go of a company's mistake if they feel they've received excellent support. Bearing this in mind, always guarantee an apology gift or discount in such adverse situations.
As you can see, building customer loyalty should be your leading strategy. It allows you to increase sales, gain an unbeatable advantage over your competitors, grow your customer base effortlessly, and develop knowledge of your target audience. You can easily implement this customer loyalty-first approach into your business by designing a loyalty program and tracking its results.
Building a loyalty program and choosing its mechanisms is only one side of the coin. The other is tracking its effectiveness for the company through so-called loyalty program KPIs, or loyalty program metrics. When evaluating loyalty program performance, the loyalty program manager should check out several key areas within the loyalty program for daily, short-term, and long-term metrics.
As a program manager, you must have a set of metrics that you look at when you start work. Verifying daily metrics is a relatively superficial look at an analytical dashboard, but it's never unreflective or hasty. When something in the daily data worries a loyalty manager, they dig deeper and look further for clues to the anomaly.
Daily checks for specific anomalies may include, for example, potential fraud in a loyalty program. Anti-fraud verification is necessary to ensure the system is secure and resistant to scams and money loss. When running loyalty programs, you're dealing with large budgets, so as a manager, you have to keep your finger on the pulse and detect vulnerabilities in the program before customers or employees misuse them.
The loyalty program manager's analytics dashboard should also include metrics that need to be reviewed over a longer period, such as monthly or annually. These metrics must be tailored to the loyalty manager's requirements and business case.
The choice of core metrics is closely related to customer segmentation and, ultimately, verification of how these customer groups are changing. In particular, the manager should consider:
Let's be clear: Every company should segment its customer base and be absolutely sure of the target audience.
Now, suppose you include a loyalty program as part of your company's strategy (as you should), and 50-60% of your customers are members of your loyalty program. In this case, your loyalty program is doing its job, and you have to focus mainly on discovering this loyal part of your customer base through proper analytics. However, don't forget to convince other customers to join your loyalty program along the way.
As for analyzing customer segments, you should do it weekly, monthly, or quarterly, depending on your business. Regular revision of basic parameters within segments is essential to stay abreast of changes. On top of that, the loyalty program depends on promotional, marketing, and sales dynamics. These wide-ranging activities significantly affect the volume and quality of customer segments.
If you have a lot of high-impact promotional activities, then you need to review segments more frequently, weekly or even daily. On the other hand, if you have relatively few promo actions during the year and the program is running on its own, a review once a month is enough to see if anything worrisome is going on, especially in those segments related to potential customer churn.
For an easy-to-use template on loyalty metrics, check Loyalty program KPIs: templates and best practices.
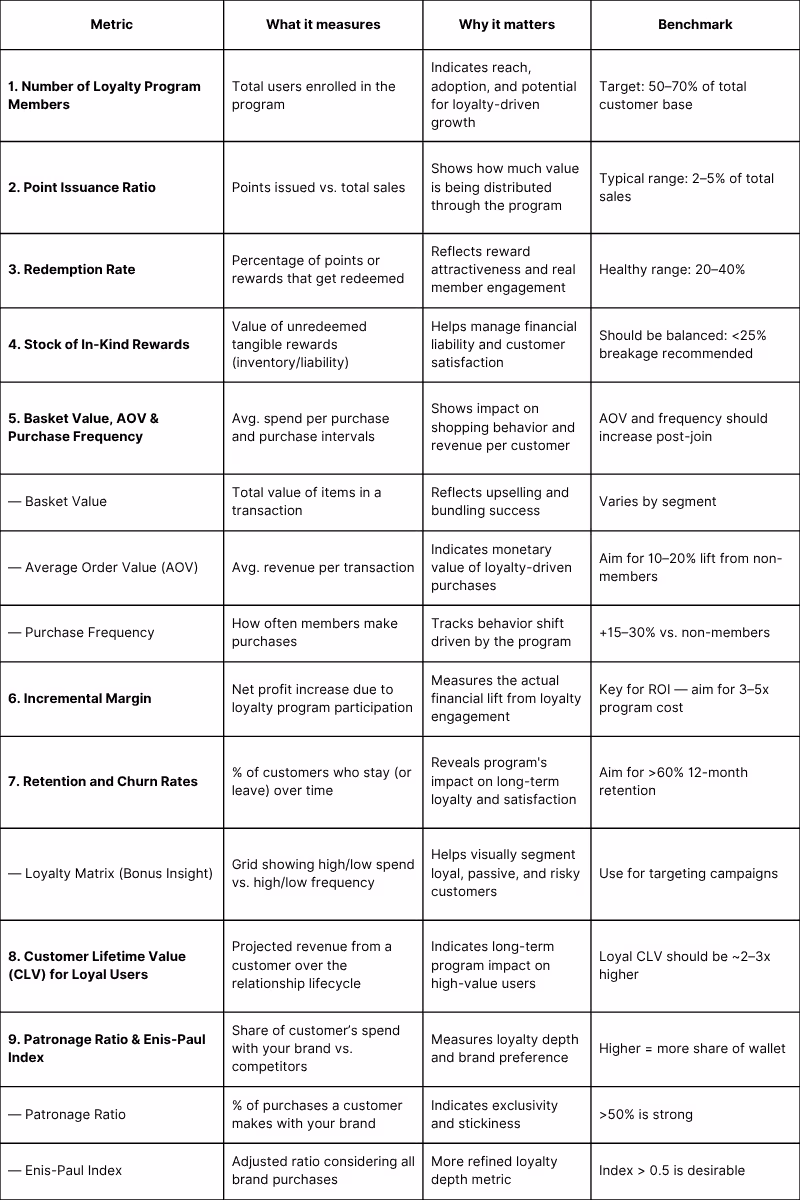
Now that you know the significance of customer loyalty and the groundwork needed before deciding on a set of metrics, you can review nine important KPIs for your loyalty program.
So, how do you measure the performance of a loyalty program?
The number of new, lost, and existing loyalty members is the very first thing every loyalty program manager focuses on after starting the work day. As you might guess, the idea is to see whether the loyalty program has gained new members over a certain period and, consequently, whether the loyalty program is fulfilling its purpose.
Acquiring new loyal customers should be a steady process, and you should see a regular growth of new members daily. The exception is when sales, marketing, or promotional departments run, for example, an outreach email campaign, Facebook ads, or TV commercials to attract new buyers. As a result, you may experience a sudden spike in the number of customers. Of course, the loyalty manager needs to be informed of such activities in advance so they aren't surprised that this metric changes unpredictably.
Fortunately, the loyalty program is often intertwined with marketing plans. This means that part of the marketing campaign is devoted solely to the loyalty scheme and the rest to product/service promotion and branding activities.
Beware that it's impossible to set general guidelines for the strength of the new and existing customers' metrics. The only proof that you're heading in the right direction is the upside value of that metric.

So, for example, if you have a new loyalty program, you may have 100 new customers on the first day, which translates into a 100% increase, but on the second day, you have only 30 new customers, so the growth is only 30%. Well, these decreases and increases can bring you a serious shock. But there's more to that.
When you have a mature loyalty program later in the lifecycle, it's even more challenging to determine what metric value is a success – it all depends on your customer base and the market you operate in. In general, as long as this metric is on the plus side, meaning you have more new customers than those leaving you, it means the program is performing well.
The point issuance ratio shows what percentage of your products/services are sold using loyalty points. Analyze this metric daily to discover how effective the loyalty scheme is in relation to your offerings. This means that if, for example, you sell $1,000 worth of computer keyboards a day, of which $700 is sold using loyalty points, the efficiency of your loyalty program is at 70% for that part of your offer.
Importantly, the point issuance ratio can be understood in two ways and applies to:
Let's start with the issuance ratio within products or services. First of all, this metric clearly shows whether loyalty customers lean more toward products/services covered by loyalty points than those that are not. That is, if you have a pool of 50 products, 40 of which are eligible for loyalty points, then 80% of the entire assortment falls under the loyalty program.
Now, let's turn to the issuance ratio in terms of customers. The key to this metric is the quality of customers, as they may or may not belong to the program. As a rule of thumb, 20-30% of customers you won't be able to convince to partake in your loyalty program, even if it were the best program in the world. That leaves 70-80% of buyers you can win over, and this is where the issuance ratio challenge kicks in.
You need to find out how many of these 70-80% customers are buying products/services that are covered by your loyalty program. Assuming that 100% of your offerings are included in the program, you'll be able to quickly figure out how many customers out of the total customer pool knowingly participate in the loyalty scheme.
Nonetheless, be sure to include in your issuance ratio calculations situations where a customer, for example, forgets their loyalty card, doesn't log in to the mobile loyalty app on time, or forgets their account password. This happens very often and can violate this metric to your disadvantage.
To summarize this part, the ideal situation is when you have around 70% loyal customers, and the loyalty program includes all your offerings. Then, if this is the case, the issuance ratio should settle at approximately 70% every day. However, when you notice a sudden drop from 70% to 50%, start dabbling, as this could mean that one of the loyalty mechanisms has been set up incorrectly. This can definitely cause customer frustration, and that's not what you want after all, right?
Redemption rate is a metric that loyalty managers review to see how many points have been redeemed for rewards in relation to the total number of issued points in a certain period of time (month or year). In addition, this metric shows how successful the loyalty program is for customers, meaning whether they're satisfied with the program's offerings and whether they redeem points for rewards at even intervals.

The redemption rate metric should be more or less constant. When it starts to drop, it means your customers would rather keep their points than redeem them for rewards. This should puzzle you because customers always want to get something extra for a purchase transaction. Also, keeping points may indicate that your prizes aren't attractive enough or that you have very tempting rewards, but they're expensive in terms of loyalty points, so customers need to be frugal.
Pawel Dziadkowiec, an expert in customer rewards and customer loyalty programs, said that the best situation is when customers actively use points because this means that your loyalty program is "healthy" and your customers enjoy using it. Loyalty points represent the company's financial reserve to the business, which is also important to understand.
On top of that, all responsible finance departments note that the financial reserve should encompass all loyalty points that are on the market and gradually decrease as points are redeemed.
Dziadkowiec also added that since some loyalty points are unused by customers, financial reserves should be at the level of the overall redemption rate, which usually is at 70-80%. The idea is to keep the company solvent if customers want to redeem points for rewards at the very same moment. When too many customers redeem points for prizes at the same time, your team can get paralyzed, and in worst-case scenarios, you can run out of rewards or have trouble delivering them punctually.
Stock in-kind rewards is a metric that shows whether you have any shortages within the inventory of your loyalty rewards. If you're keeping a physical stock of prizes, you'll need to keep track of it so that you don't fall short of promised rewards.
Imagine empty store shelves and your customers wandering the aisles struggling to find something attractive. As you might guess, you won't make any sales that day. The same truth applies to rewards – empty warehouses mean that customers cannot redeem loyalty points for prizes.
On top of that, if a customer spots a prize from your catalog and makes an effort to come to your store to redeem points, but you're not well-prepared for this transaction, you can only imagine their frustration. This is why paying attention to the stock-in-kind rewards metric is essential to your company's reputation.
Keeping a physical inventory of rewards is becoming increasingly rare, as managing them is much more challenging. The same goes for custom-created and personalized rewards, which require a lot of time and effort to prepare. Loyalty expert Pawel Dziadkowiec added that it's most profitable to redeem points for products you regularly sell as part of your daily business. The points are then included in the receipt – it's a standard financial discount on the purchase transaction.
Let's discuss this case in more detail: If you have a restaurant loyalty program, you can award 1 point for every 1 cent spent on your dishes. Then, if the customer collects enough points, they can pay for their favorite meal partly with loyalty points and partly with money. As you can see, there's no physical reward, just a discount on your standard offer.
When loyalty rewards are part of your product line, they're easier to manage. After all, you have standing orders and contracts with companies that deliver them to your warehouses or stores, so you can confidently guarantee them to your customers.
Still, if you'd like to give your buyers something outside the regular offer, you can also consider various types of digital rewards, such as movie tickets, vouchers for Spotify, HBO, or TIDAL. Prizes in the form of electronic codes or discount codes are the easiest ones to order and distribute to customers. Loyalty partnerships could be the right step forward in this case.

The bottom line is that if you opt for physical rewards, you must ensure they are in stock. For electronic rewards, you need to know that you have a current contract with the partner in question.
The loyalty manager should also verify the basket value, average order value, and purchase frequency, which are purely sales metrics but are also related to the loyalty program's performance. Let's go through them quickly.
The basket value, a crucial metric in retail, represents the average dollar amount shoppers spend in a single purchase transaction.
Understanding and optimizing the basket value is instrumental for businesses aiming to enhance customer lifetime value. By implementing effective loyalty programs, companies can incentivize higher spending in each transaction, positively influencing the basket value. Through customer satisfaction initiatives tied to loyalty programs, companies can create a more engaging shopping experience, encouraging customers to make more prominent and more frequent purchases.
The evaluation of basket value within the context of customer loyalty becomes essential, as loyal customers tend to contribute significantly to the overall increase in this metric.

The average order value, also known as the average purchase value, reflects the average dollar amount spent each time a customer orders through various channels like a website, mobile app, or standard in-store check-in.
For businesses aiming to enhance customer loyalty, analyzing the correlation between average order value and loyalty program members is imperative. By tailoring loyalty programs to reward higher spending, companies can increase the average order value and strengthen the connection with their customers.
Improving customer satisfaction through personalized offers and perks embedded in loyalty programs can further contribute to an elevated average order value, positively impacting the business's overall financial performance.
Purchase frequency, synonymous with repeat purchase rate, gauges the number of customers who return to a business repeatedly versus those who make one-time purchases.
Understanding the dynamics between purchase frequency and customer retention is essential for devising effective loyalty programs. By offering incentives and rewards through these programs, businesses can encourage customers to increase their purchase frequency, fostering a sense of loyalty. Customer satisfaction is the cornerstone for determining purchase frequency, as satisfied customers are more likely to return.
That's why a well-designed loyalty program that addresses customer satisfaction can significantly boost both customer retention and purchase frequency, ultimately optimizing loyalty program performance.
Now, if your loyalty program covers 70% of your customer base, it'll be easier for you to examine the shopping basket and experiment to boost its value. For example, you can apply double or triple loyalty points for:
Also, when analyzing the shopping basket value, you must take into account occasional promotional or marketing campaigns lasting several hours, days, or months, as they have a measurable impact on the final value of this indicator.
Basket value, average order value, and repeat purchase rate are individual matters for each business. It's impossible to make a general assessment of what metrics values are considered a success, except that they should always be greater than zero.
On top of all this, there is the well-known aspect of the seasonality of products/services. For example, people buy more during the holidays, and their average purchase may exceed several thousand dollars. On the other hand, you may experience a drastic drop in January. Don't worry, though! To avoid panic, you can watch these metrics to spot trends relevant to your brand, industry type, and seasonal demand.
Incremental margin is a metric that shows the average margin you get from your customers' daily purchases. Of course, your offerings may include low-margin and high-margin items, which you should consider when analyzing the incremental margin metric beforehand.
The loyalty activities you conduct not only drive sales but also disproportionately increase margins. If you earn an average of 20% margin on the product and add another 5% margin through loyalty program activities, you end up with a 25% margin within the product.

You can effectively steer customers' attention toward high-margin items by carefully managing the loyalty points you distribute. The loyalty program members always receive added value to the shopping transaction, so they won't even notice the margin imposed on the products/services purchased.
Again, there are different business cases and many influencing factors, so defining a single indicator for margins isn't feasible. That said, you should think strategically when managing margins as part of your offering.
Pawel Dziadkowiec, the loyalty expert, mentioned an excellent example with gas station businesses that have low margins on fuel alone, but still, you can find hot beverage cafés with an imposed margin of 50%-80%. Aromatic coffee is quite hard to resist, so customers are eager to reach for it, especially since they can receive additional loyalty points with their purchase.
In summary, it's best to use average margins of 20%. Then, you can add another 1-5% under the loyalty program, giving an outstanding result.
Customer retention and churn rates show the overall success of a loyalty program and how strongly customers stick with your offer.
The customer retention rate is the ability to retain a customer. At this point, you shouldn't think about the quality of a customer's purchases, that is, whether they buy from you a lot and often – all that matters is that they do buy.

On the other hand, churn rate is customer outflow – your customer stops buying from you and moves away from your brand and offerings, usually to another supplier.

The segmentation and micro-segmentation aspects are crucial for retention and churn rates. In the process of segmenting your consumers, you can divide them into smaller and more specific groups in terms of their behavior, such as:
Imagine being a provider of taxicab rides and electric scooter rentals through a mobile app. If you notice that a customer is using your cab services less frequently, such a person immediately moves into the "high risk of churn" segment. Then, if they stop entering your mobile app at some point, this should trigger your special attention – it means you're close to losing that customer forever. You need to act here and now, preferably by means of a loyalty scheme.
You can offer such a person a discount on future taxicab rides or send them information about the nearest transportation in their area every time they move away from the location assigned as "home" in the mobile app. However, note that it's quite a challenge to convince customers to repeat purchases if their needs have changed and, for example, they've started walking instead of using paid rides. Still, you have to give it a shot and try to retain them or even make them repeat customers using rewards.
In summary, single out segments with 20% of customers where your loyalty team needs to provide personalized support. According to the Pareto principle, you should be able to retain the remaining 80% of your customers without additional effort.
If you're running a loyalty program, it should be more about what has happened (hard and complex data), not what might happen (predictive analytics data). For this reason, you need to divide customer behavior into two types:
You can use the loyalty matrix provided by Walker to segment your customer base easily. The loyalty matrix is a framework you can employ to further divide your customers into four groups based on their answers to a small battery of questions. These four groups are accessible, truly loyal, high-risk, and trapped.

The two axes you can see in the matrix represent two key aspects of loyalty:
Use this framework wisely, and you're sure to come up with new ideas for strategies for customer engagement, so working on retention and churn rates.
Customer lifetime value (CLV) is a business metric that shows how much a company can earn from average customers when they're loyalty program members. According to the Handbook of Market Research, the CLV metric is the value of individual customers, based on their past, present and projected future cash flows.

A consumer is labeled as "viable" as long as they're registered in your customer database. If they generate unnecessary costs and don't buy from you, you should remove them from the database as they negatively influence company profitability.
In practice, it's very cumbersome to determine exactly when a customer crosses the point of unprofitability from a forward-looking perspective. What's even more interesting, says Open Loyalty expert Pawel Dziadkowiec, , is that any reactivation or win-back campaigns targeting inactive customers could often spur them back to profitability.
The good thing, though, is that if you use customer lifetime value as your primary metric, you'll at least gather information about which customers are responding to your communications and which are not. You'll also be able to predict which buyer group is still worth investing in and which is not.
Finally, let's turn to the patronage ratio and Enis-Paul index, which are closely related to customer service and soliciting customer feedback on how willing they are to recommend your loyalty program and brand.
According to The Loyalty Guide, the patronage ratio compares the number of stores available to a customer where they can buy goods from a specific product category (during a certain period) with the number of stores that the customer patronizes during that period.
The main problem with this indicator is that it doesn't show movements in the purchasing pattern or in loyalty itself over the period analyzed. For example, one person may leave your competitor and join your customer base, but in the meantime, one of your existing customers may drop out in favor of a rival brand. In this way, both customers may achieve the same ratio score.
Another metric is the Enis-Paul index, which is used to calculate the consumers' propensity to patronize a particular store during a given period. In this indicator, 100% defines absolute loyalty, and 0% represents total promiscuity.
To achieve 100% in the Enis-Paul index, your customer would have to patronize several of your stores, spend a large share of their budget at the preferred stores, and display no behavior associated with switching to a competing brand.
Do you think you'd get 100% using your customer loyalty program? We hope so!
In this guide, we peeled back the layers to reveal the nine essential metrics that shine a light on how loyal and satisfied your customers really are with your loyalty program. Think of it as a starting point for analyzing the loyalty program.
And here's a little heads-up: the more customer loyalty metrics you have, the more difficult it will be to analyze and guide your loyalty scheme!
To ensure you're well-equipped, we'll also give you a quick tour of additional key indicators of loyalty program success, such as:
This metric measures the frequency at which customers switch from using your brand to a competitor. A lower switching ratio indicates higher loyalty, as customers are sticking with your brand despite the presence of alternatives.
Example: Let's say a coffee shop measures its switching ratio by tracking how often customers who initially chose their brand switch to a competitor within a given period. If only 5% of customers switch to a competitor in a month, the switching ratio is low, indicating a high level of loyalty.
The budget ratio represents the proportion of a customer's total spending in your category allocated to your brand. It offers insight into how much of their available budget customers are willing to spend with you versus your competitors.
Example: If a customer has a total spending budget of $1,000 for electronics, and they allocate $400 of that budget to purchasing products from your brand, the budget ratio for your brand would be 40%.
NPS gauges customer loyalty and satisfaction based on a straightforward question: How likely are you to recommend our brand/product/service to a friend or colleague? This metric scores from zero to ten to categorize customers into promoters (nine and ten), passives (seven and eight), and detractors (zero to six), providing a clear picture of brand advocacy.
Example: After conducting a survey, you find that 60% of respondents are promoters (scoring 9 or 10), 25% are passives (scoring 7 or 8), and 15% are detractors (scoring 0 to 6). Calculating the NPS by subtracting the percentage of detractors from promoters, you get an NPS of +45 for your brand.
Unlike traditional metrics that focus on purchase behavior, attitudinal equity measures customers' emotional connection and positive attitudes toward a brand. This can include trust, preference, and overall sentiment.
This composite metric combines several factors, including repurchase behavior, likelihood to recommend, and overall satisfaction, to give a holistic view of customer loyalty.
For loyalty programs specifically, the enrollment rate tracks the percentage of eligible customers who decide to join the program. It's a critical metric for assessing the loyalty program's initial appeal and perceived value.
Beyond just signing up, this metric looks at how many members actively participate in the program. It measures actions such as redeeming rewards, engaging with program communications, or participating in program-specific promotions.
This metric evaluates the effectiveness of loyalty programs in reducing the need for discounts to drive sales. It assesses whether loyal customers are willing to purchase without heavy discounting, which can improve profit margins.
The upsell ratio tracks how often customers enrolled in the loyalty program purchase more expensive items or add-ons compared to non-members. This metric indicates the program's effectiveness in driving higher-value sales.
Like the activation rate, the participation rate measures the degree to which members engage with the program by taking advantage of its benefits and participating in its activities. A higher rate suggests a more compelling and valuable program to its members.
Expanding your dashboard to include more than these nine loyalty program metrics is acceptable, but only if you notice something disturbing in customer loyalty or want to investigate a trend. Also, if you wish to go deeper into the data, it's best to engage a dedicated team of analysts and leverage their expertise to save your time as a program manager.
The most important KPIs for loyalty programs include redemption rate, engagement rate, customer lifetime value (CLV), repeat purchase rate, and churn rate. These indicators help track how members interact with your program and whether it drives profitable, long-term behavior.
Success is typically measured through a mix of financial and behavioral KPIs. For example:
A loyalty dashboard or analytics tool can help you consolidate and interpret these data points.
Redemption and engagement rates directly influence loyalty program ROI. If engagement is low, the program likely isn’t influencing buying behavior. If redemption is too low, members may feel rewards are unreachable. On the flip side, very high redemption might cut into margins. Striking the right balance improves retention and drives repeat sales raising your ROI.
Industry benchmarks vary, but a healthy redemption rate typically ranges from 20% to 40%. For example, top-performing eCommerce brands often aim for 35%+ to ensure rewards feel attainable without eroding margins. Tracking this metric over time is essential to fine-tune your offer structure.
Customer lifetime value measures the total revenue a customer is expected to generate over the course of their relationship with your brand. Loyalty programs aim to increase CLV by driving more frequent purchases, upsells, and longer retention. Segmenting CLV by loyalty tier can help tailor rewards more strategically.
Repeat purchase rate is the percentage of customers who come back to buy again. In loyalty programs, it signals whether the program is effectively building habits. You can track this by dividing the number of returning customers by the total number of customers over a given period.
Churn rate tells you what portion of customers stop engaging or buying. A rising churn rate might signal that the loyalty program is failing to deliver value or that rewards aren’t compelling enough. When analyzed alongside retention and engagement rates, churn provides a fuller picture of program health.
Use a loyalty analytics dashboard or dedicated platform like Open Loyalty. These tools let you monitor KPIs like redemption rate, CLV, ROI, and churn in real time so that you can quickly spot what’s working and where to optimize.

Get the right metrics for your business, stick to them, and don't lose sight of your goal. When necessary, find good partners and promote loyalty program audits. Building customer loyalty takes time, but you have an edge with marketing strategies tied to a good loyalty program. Bet on consistency, adaptability, and customer-focused practices to succeed.
—
For more articles like this one, make sure to follow our LinkedIn channel and stay up to date on all our latest content.
To get some loyalty program inspiration, check out the Top 100 Loyalty Programs report, or peek into the future of the loyalty industry with our Loyalty Trends 2022 research.
API-first loyalty and gamification engine

Get a weekly dose of actionable tips on how to build and grow gamified successful loyalty programs!