A churn prediction model built for loyalty behaves differently than one built for generic SaaS usage: it scores points-earning velocity, redemption cadence, and tier trajectory, not login frequency.
Getting this right means catching at-risk members while they're still earning, just slower. This guide breaks down what a loyalty-specific attrition model actually scores, how it differs from an RFM rule, and the playbook for turning a risk score into a saved member.
As loyalty program trends evolve, member expectations around personalization and instant recognition are raising the bar for what counts as a healthy, engaged account.
An attrition-scoring model in a loyalty program helps teams identify at-risk members by scoring five signal categories: points-earning velocity decline, redemption drop-off, tier stagnation and downgrade risk, engagement-frequency decay, and referral and advocacy drop-off.
These diverge from the generic indicators baked into customer success software, such as login frequency, because loyalty behavior compounds across weeks of customer data from transactions, not single sessions. The cost of missing it compounds fast: a member flagged and re-engaged in week two costs a fraction of one who's already gone quiet by week eight.
If you're evaluating platforms that can surface these signals automatically, our loyalty software comparison guide breaks down how the leading vendors handle attrition scoring and engagement tracking.
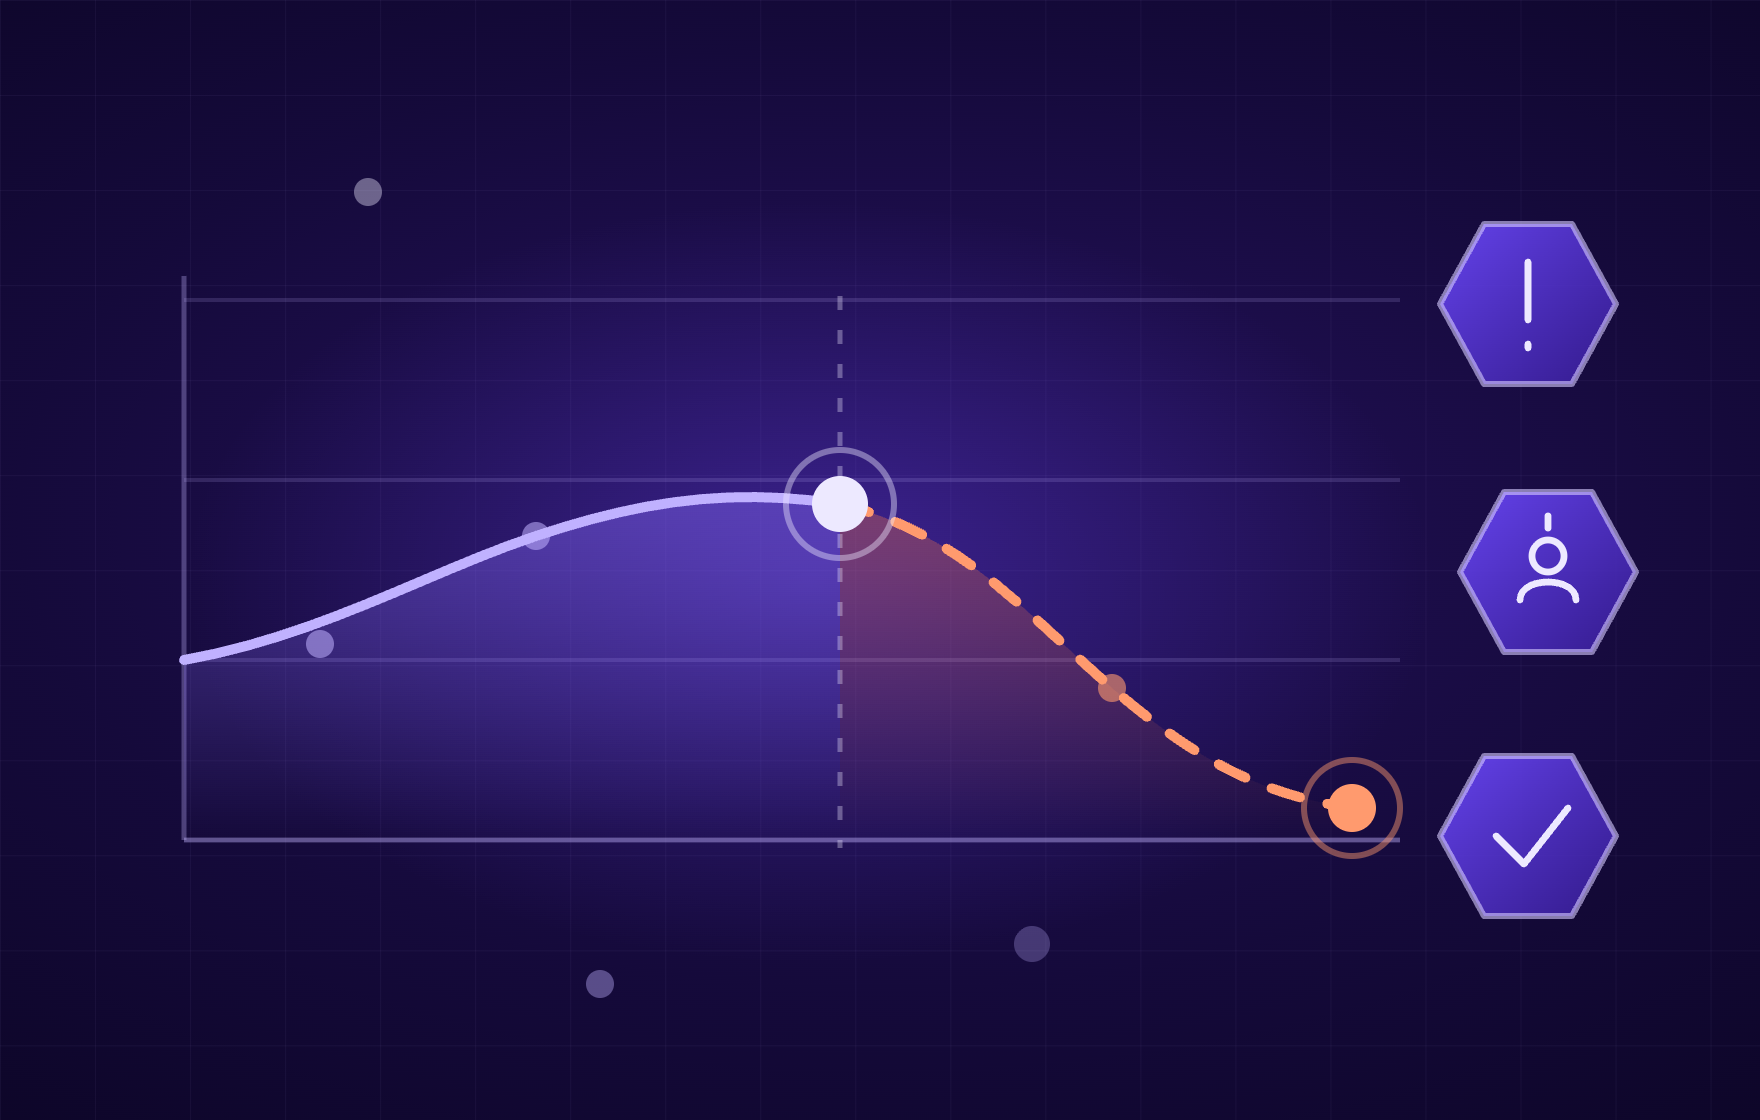
Redemption drop-off tends to precede a full lapse by several weeks — a window retention teams can act inside rather than react after.
SwipeRx's 91% customer retention rate, achieved through loyalty and gamification mechanics, is the kind of outcome that window makes possible when a program acts on it. These early-warning windows are most actionable when teams are already building a loyalty program success plan that defines clear intervention triggers and win-back thresholds.
Scoring these signals lets teams predict which members are drifting toward churn and protect customer lifetime value (CLV), before spend, frequency, and advocacy quietly fall to zero.

An attrition-scoring model differs from RFM segmentation on one point: RFM sorts members into a static bucket, while a predictive model forecasts the probability that a specific member churns within a defined window.
RFM segmentation groups customers by recency, frequency, and monetary value snapshots taken at a single point in time. It tells a team who is already disengaged, not who is about to be.
An attrition-scoring model built with machine learning, often using logistic regression as a common churn-prediction method, ingests the same raw inputs, plus rate of change: how fast points-earning velocity is declining, how many weeks since the last redemption, whether a member is stalled below a tier threshold. That is a different data problem than a rule can solve.
Building one for a loyalty program requires three operational decisions an RFM rule does not: feature selection across the five signal categories covered above, a training window (typically 6 to 12 months of member history), and a retraining cadence, usually monthly, since reward-catalog changes and tier restructures shift what "normal" behavior looks like.
Skip retraining and the model drifts against reality inside a quarter. Feature selection should be grounded in core loyalty program metrics, since the model is only as good as the signals it monitors for drift.
This is also where loyalty differs from generic customer success software. Tools like ChurnZero forecast renewal risk from product usage and login health, useful for SaaS accounts but blind to points balances or tier position.
A loyalty churn model scores five behavioral signals that a generic customer usage dashboard never surfaces: points-earning velocity decline, redemption drop-off, tier stagnation and downgrade risk, engagement-frequency decay, and referral and advocacy drop-off. Each one is a distinct data source feeding the same attrition-scoring machine learning model, which uses multiple data sources to predict churn from changing behavior patterns rather than static data alone. In practice, historical customer data often requires feature engineering to accurately predict churn prediction models’ outputs.
Data aggregation can also pull from CRM systems, product usage logs, and support tickets when those sources exist.
No single signal predicts churn reliably on its own. A member can slow points-earning velocity during a seasonal lull and recover fully. What the model looks for is co-occurrence, where combined signals reveal hidden patterns in behavioral patterns; redemption drop-off arriving alongside engagement-frequency decay is a materially stronger risk indicator than either alone, which is precisely the interaction an RFM rule can't weight.
Redemption drop-off tends to be the earliest tell, arriving before engagement frequency visibly drops and well before a canceled account or a lapsed renewal shows up on a retention dashboard. Some advanced platforms also use sentiment analysis on customer interactions; Zendesk, for example, analyzes 100% of customer interactions to predict churn risk.
Tier stagnation deserves its own attention because it carries a compounding risk: a member who stalls below their current tier's maintenance threshold isn't just disengaged, they're weeks from an automatic downgrade that will accelerate the churn it was meant to predict.
Treating that threshold as a hard trigger, not a soft flag, is where a rule-based segment falls short and a scored model earns its keep.
Routing at-risk members starts the moment a propensity score crosses a defined risk threshold, not when someone reviews a dashboard days later.
The attrition-scoring model that flags churn risk for a loyalty program needs to hand its output somewhere a human or an automation can act on it.
That output is the propensity score, refreshed on the same cadence the model retrains, feeding a CRM or customer success hub - the same system already holding RFM segmentation, CLV data, and renewal dates. In some customer health setups, that score is also shown on a 0–100 scale for readability, as with Accoil, so teams can identify customers without decoding model output.
Some teams route this through customer success software such as ChurnZero; others use the CRM's own health-score module, and platforms such as Pecan identify at-risk accounts weeks in advance before that handoff. The mechanism matters less than the score landing next to the record, not in a separate analytics tool nobody checks, and it should make sense to frontline teams when they review Risk Accounts.
From there, the playbook is threshold, action, window:
High propensity + high CLV → an outreach queue for an account manager, not an automated email
Mid propensity + redemption drop-off → a win-back campaign with reward escalation, launched within days
Low propensity + tier-downgrade risk → a lighter nudge timed to the member's typical purchase cycle
Timing decides whether the routing works for agents across your network. In loyalty deployments we've observed, the gap between the first redemption drop-off signal and an actual lapse runs roughly two to six weeks - narrower for high-frequency categories like grocery or pharmacy.
A win-back campaign fired after that window closes is forecasting a loss that has already happened, not preventing one — routing beats the clock only when current customers are identified and re-engaged before they churn, not after, especially when teams use customer health to surface risk customers early.
According to Bain & Company's retention research, popularized by Fred Reichheld, lifting customer retention by 5 percentage points can increase profits by 25 to 95 percent — which is why the routing decision, not the reward design, is where retention-rate lift actually gets won or lost.
Loyalty teams evaluating hyper-personalized reward engines should treat that as the next step, once at-risk members are already caught and moving through a win-back campaign — see our guide to hyper-personalization in loyalty programs for how reward selection works once someone is re-engaged.

A win-back campaign should launch the moment an attrition-scoring model crosses a fixed risk threshold, not after a member has gone fully dormant. Waiting for zero activity means the campaign competes with a churn rate that's already realized, not one you can still prevent churn.
In loyalty programs specifically, redemption drop-off tends to precede full lapse by a measurable window rather than disappear into it. Falling redemption rates precede visible churn by months, acting as an early-warning signal (Influencers Time - Loyalty Redemption Rates 2024).
In practice, two consecutive missed redemption cycles combined with declining points-earning velocity is a stronger trigger than a single quiet month, and reviewing existing customers this way helps retain customers before a static RFM segment rule flags them too late, because it only reacts once frequency has already collapsed.
The economics justify acting early: acquiring new customers costs 5 to 10 times more than retaining current customers, so the profit math to reduce churn only holds if the campaign fires inside the redemption-drop-off window, before the CLV it's meant to protect is already forfeited.
Feed the same propensity scores into a shared analytics hub that surfaces success insights alongside CAC and CLV, so retention and CRM teams work from one forecast, not two. Customer success software such as ChurnZero applies identical health-score thresholds to renewal risk, proof the timing principle holds across customer success generally, not only loyalty.
Reward escalation beats discounting because it targets a member's specific attrition risk, not general price sensitivity. A propensity score tells you how likely a member is to churn; it doesn't tell you they want 20 percent off. Escalating tier benefits, bonus points multipliers, or early catalog access addresses the actual gap - stalled progress - without training the customer base to wait for markdowns.
Timing decides which move works. A member flagged by an attrition-scoring model 30 to 45 days out from likely lapse still has enough active life left to respond to a points boost or a status nudge. Wait until points-earning velocity has fully collapsed or tier stagnation has hardened into visible downgrade risk, and the same offer reads as damage control, not recognition.
Discounting also erodes average order value (AOV) once it becomes a habit: customers pattern-match to the offer instead of the product and delay purchases until the next markdown. Reward escalation protects AOV by rewarding volume and frequency, which is the behavior a loyalty program exists to reinforce.
That profit math — a few points of retention move margin far more than any single discount does — is reason enough to treat intervention timing, not discount depth, as the lever that protects it.
Proactive outreach only works when it has an owner and a clock, not just a score. Most loyalty programs stall here: an attrition-scoring model flags a member as high risk, and nobody moves for three weeks because ownership sits nowhere between CRM, customer success, and campaign ops.
We recommend assigning risk tiers to specific owners and windows before the model goes live, not after the first false start.
The CDP is what makes the schedule possible by organizing the necessary steps. It merges transactional, engagement, and points-velocity data into one customer record and pushes the current risk score into the CRM hub, so whoever owns the action can see it without pulling a report. Without that pipe, the attrition-scoring model produces a list nobody actionably identifies against in time.
The economics justify the discipline: a missed 24-hour window is quietly forfeiting the same CLV the profit math above says is worth protecting.
Churn prediction works when churn rate actually falls, and a good customer churn rate often lands around 5 to 7 percent; track three numbers: churn rate, retention-rate lift against a control cohort, and customer lifetime value (CLV) protected in the accounts the model flagged. Engagement upticks alone tell you the campaign fired, not that it changed behavior.
The retention-economics case is well established, and it's the frame we use to justify the cost of running an attrition-scoring model at all: a model that costs real engineering time only pencils out if the members it saves are worth more than that cost, which the next two numbers settle for the business. It also helps teams prioritize by revenue, not just raw account count.
Run the comparison properly: hold out a control group that receives no intervention, then measure retention-rate lift and CLV protected against it over 90 to 180 days. A model that only reduces churn in members who were never going to leave is not forecasting risk, it is identifying the healthy base.
Customer success teams running platforms like ChurnZero surface similar health scores for SaaS renewal risk, but the loyalty-program version needs its own analytics hub, one where points velocity, redemption drop-off, and tier stagnation feed the same dashboard as retention rate and CLV. Review model accuracy quarterly. If predicted risk stops correlating with actual lapse, check data quality first because it significantly impacts churn prediction accuracy, then retrain before the next campaign cycle, not after.
How is churn prediction different from an RFM rule? An RFM rule flags a static snapshot — recency, frequency, monetary value at one point in time — so it tells you who is already disengaged. A churn prediction model scores the rate of change across several signals together, making customer churn prediction software a form of prediction software that forecasts who is about to be, often 60–90 days before renewals rather than just weeks before an RFM bucket would catch it.
How often should we retrain the model? Monthly is the common cadence for a loyalty program, tighter than most generic customer-success models need, because reward-catalog changes and tier restructures shift what "normal" behavior looks like faster than typical SaaS usage patterns do. Review accuracy quarterly and retrain sooner if predicted risk stops correlating with actual lapse. For comparison, Gainsight offers broader customer-success workflows, and its churn prediction software uses machine learning to analyze customer data for churn prediction alongside health scoring and segmentation.
What's a reasonable propensity threshold to start with? Start conservative and let false positives guide the calibration. A threshold that flags too few members means real churn slips through; one that flags too many burns out the team and erodes trust in the score. Most teams tighten it after the first full retraining cycle, once they can see how many flagged members actually lapsed.
How do we avoid over-contacting at-risk members? Route by risk tier, not by every score change. A member who crosses the threshold once needs one well-timed touch, not a new email every time the model re-scores; cap outreach frequency per member per campaign window, and let escalation (not repetition) carry the follow-up.
What if our loyalty program doesn't have tiers? The signal categories still apply. Points-earning velocity decline, redemption drop-off, engagement-frequency decay, and referral drop-off are all observable without a tier structure. Tier stagnation simply drops out as a signal, and the model weights the remaining four.
How much member history do we need before the model is useful? Six to twelve months of transaction history is the typical training window. Programs younger than that can still track the underlying signals manually — redemption drop-off and engagement decay are meaningful even before there's enough data to train a model on them.
Spotting points-earning velocity decline or redemption drop-off only matters if it triggers action fast enough to protect customer lifetime value (CLV). Route every at-risk score into a defined win-back campaign with a clear window, not a queue that ages before someone notices.
Software built for customer success, the kind teams reach for instead of ad hoc ChurnZero-style scoring, treats Customer Churn Prediction Software as one prediction software workflow, not two separate tools; with the right tools, a Business can mitigate churn and protect Revenue. For larger teams, evaluation should also weigh fast setup and enterprise grade automation when product analytics brings together product data, billing information, renewal history, sales, and customer feedback. Once your team can identify tier stagnation, engagement-frequency decay, and referral drop-off in the same view, retention stops being reactive.
To map churn signals to your own program, explore Open Loyalty's customer retention software, especially since losing existing customers is costly because acquiring new customers can cost 5 to 10 times more.

API-first loyalty and gamification engine

Get a weekly dose of actionable tips on how to build and grow gamified successful loyalty programs!